| Model | Completed laps | Collisions | Paired lap time |
|---|---|---|---|
| Previous fast model | 179/210 | 31 | baseline |
| Edited weights | 188/210 | 22 | -0.0077% |
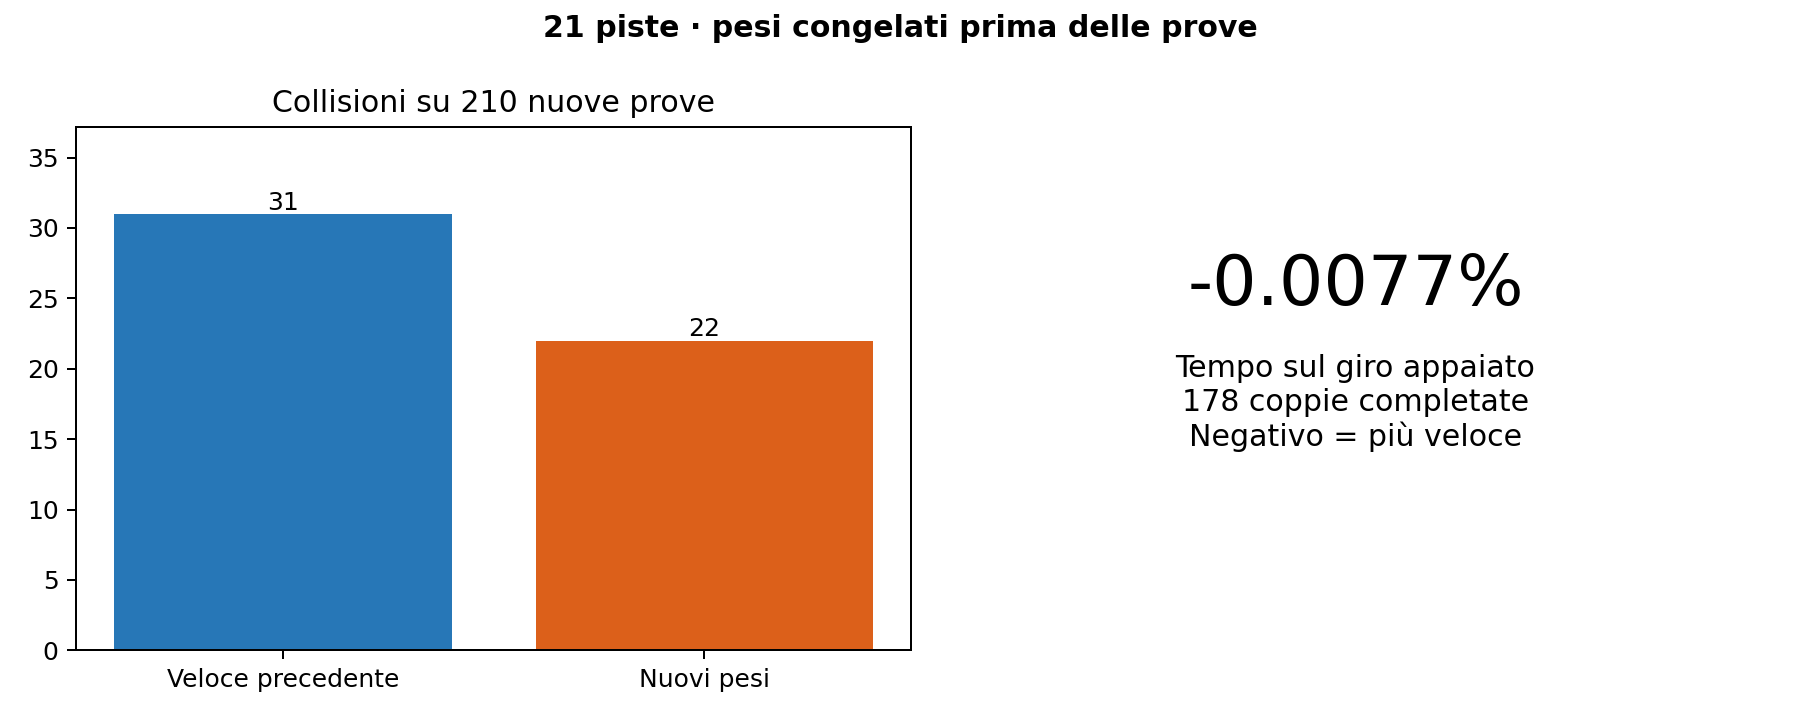
Two changes to the weights
The left-wall threshold moves from 0.4 to 0.6 m. A two-ray Gaussian filter, about 0.5°, is folded into first-layer rows 1, 14, 41 and 61 only. Compared with the previous candidate, 4,321 scalars change. The shared layers also affect speed. Across 9,319 development observations, the mean absolute change in commanded speed is 0.01046 m/s.
| Hypothesis | Completions (previous model 12/21) | Paired lap time |
|---|---|---|
early_panic |
14/21 | +0.012% |
exit_support |
0/21 | — |
exit_only |
0/21 | — |
exit_approach |
14/21 | +0.313% |
early_smooth |
15/21 | +0.109% |
turn_preview |
12/21 | -0.894% |
Generic corner-exit corrections lead to zero finishes. Previewing right turns speeds up some laps but loses successes. On the 210 previously observed starts from phase three, both early_panic and early_smooth complete 184 laps against 180. The latter better preserves pace and is frozen before ten new starts per track from 50101 to 51010.
Wall clearance at the body of the car
The simulator’s detector uses a length of 0.3302 m and excludes sideslip from its velocity projection. A separate audit compares the oriented 0.58 × 0.31 m body rectangle with occupied map pixels every 0.01 s. Across 420 episodes and 1,774,769 poses, contacts appear in seven completed laps for the previous model and eleven for the candidate. Finishes without sampled contact rise from 172 to 177. On the 170 contact-free pairs, time changes by −0.0037%.
In the prespecified seed-50101 cohort, 17 tracks have a paired finish. On average, path length increases by 0.0072%, the fifth percentile of body clearance improves by 0.403 cm and the 95th percentile of distance from the racing line falls by 0.602 cm. Map resolution and motion between poses limit these measurements. Budapest, Monza and Spa were chosen for the figures before testing.
Each episode lasts up to 200 simulated seconds. Finishing requires visiting at least 99% of the waypoints in order and crossing the start line without a simulator collision. Models share starting poses and LiDAR noise. Times compare laps completed from the same starts by the specified models. A negative value means a faster lap.
Interpreting raster clearance
For each pose the audit rotates the body rectangle and treats each pixel with intensity ≤128 as an occupied square. A spatial index selects nearby cells, then polygon-to-polygon Euclidean distance measures separation. Zero denotes contact or overlap. Racing-line error uses the nearest segment, and travel distance uses the polyline through recorded body centres. The exploratory 0.1 s traces precede the final 0.01 s recordings.
At YasMarina 2202 the centre is 3.91 cm clear of the wall at launch but the body already intersects it. Across all final outcomes, episodes with at least one raster contact fall from 30 to 23 and contacting poses from 123 to 98. Seven of the candidate’s eleven finishes with contact are at Monza, three at Oschersleben and one at YasMarina. At Monza an independent check finds a corner of the car controlled by wall_panic_fast inside an occupied cell at 36.33 s, seed 50101. Map resolution is 9.585 cm per pixel.
Finishes and times by track
| Track | Previous model | Candidate | Paired lap time |
|---|---|---|---|
| Austin | 9/10 | 9/10 | +0.090% |
| BrandsHatch | 10/10 | 10/10 | -0.010% |
| Budapest | 9/10 | 10/10 | +0.014% |
| Catalunya | 10/10 | 10/10 | +0.010% |
| Hockenheim | 10/10 | 10/10 | +0.029% |
| IMS | 8/10 | 8/10 | +0.000% |
| Melbourne | 10/10 | 10/10 | -0.024% |
| MexicoCity | 10/10 | 10/10 | +0.031% |
| Monza | 3/10 | 7/10 | +0.101% |
| MoscowRaceway | 9/10 | 10/10 | -0.181% |
| Nuerburgring | 10/10 | 10/10 | -0.031% |
| Oschersleben | 9/10 | 9/10 | -0.019% |
| Sakhir | 9/10 | 10/10 | -0.072% |
| SaoPaulo | 10/10 | 10/10 | -0.012% |
| Sepang | 10/10 | 10/10 | -0.020% |
| Silverstone | 10/10 | 10/10 | +0.013% |
| Sochi | 0/10 | 0/10 | — |
| Spa | 8/10 | 10/10 | +0.050% |
| Spielberg | 10/10 | 10/10 | -0.062% |
| YasMarina | 5/10 | 5/10 | +0.164% |
| Zandvoort | 10/10 | 10/10 | -0.053% |