| Comparison | Original | Edited | Paired lap time |
|---|---|---|---|
| First candidate, development | 17/20 | 17/20 | -1.68% |
| First candidate, 17 other tracks | 67/85 | 66/85 | -1.91% |
| Cautious candidate, development | 17/20 | 17/20 | +3.87% |
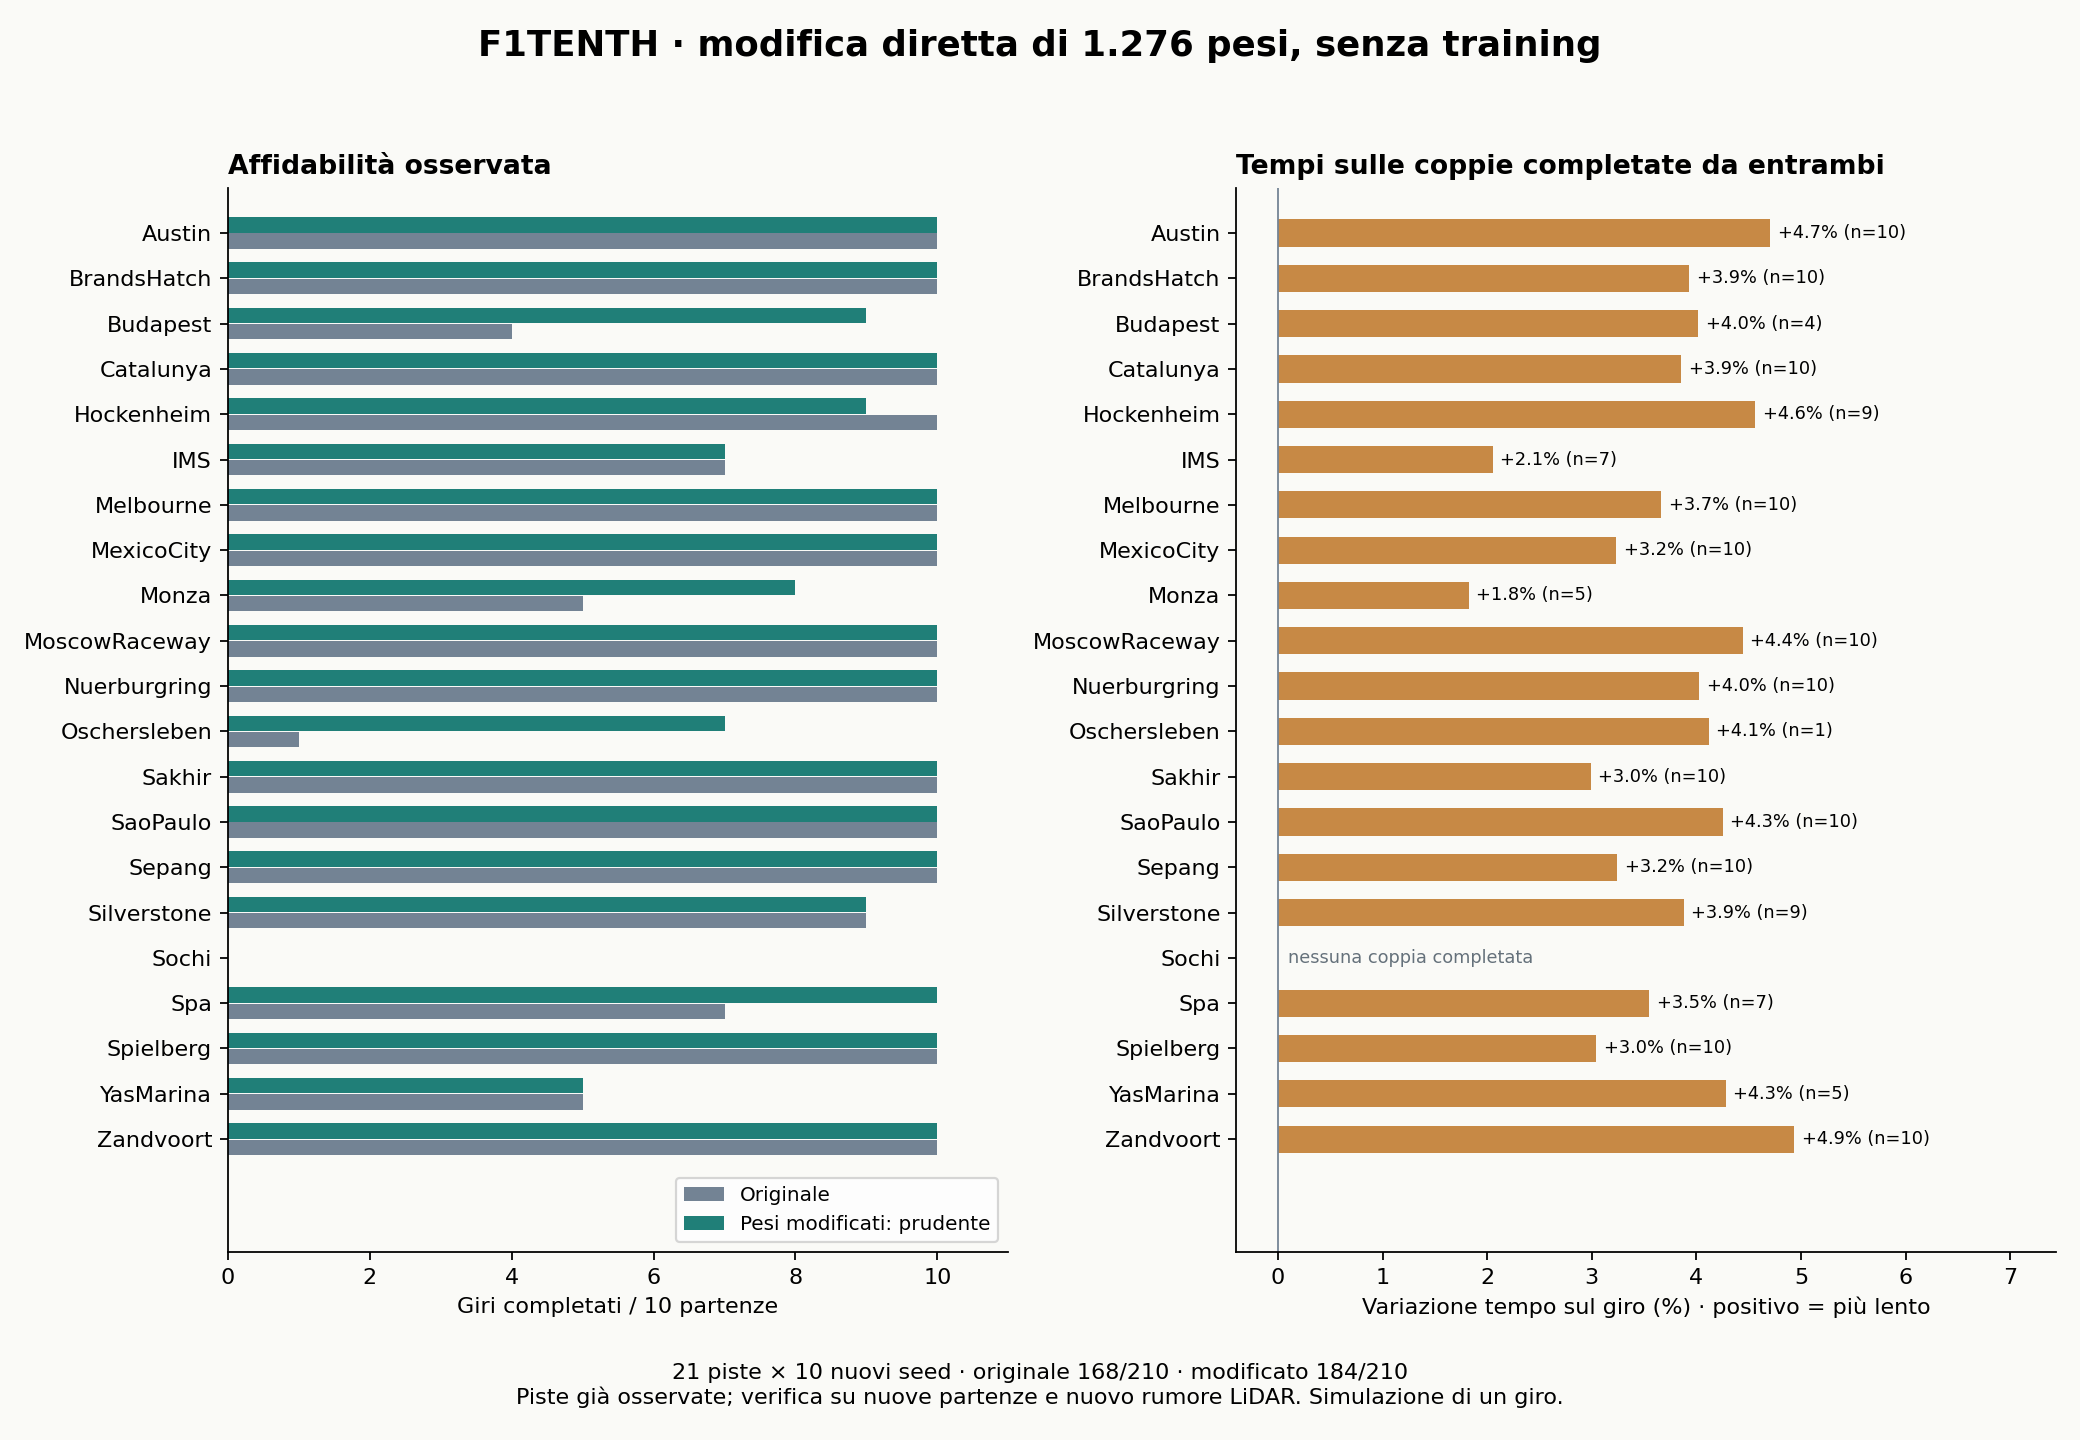
| Cautious candidate, final test | 168/210 | 184/210 | +3.77% |
Two neurons measure forward clearance
The learned actor takes 1,080 LiDAR rays and computes steering and speed through two hidden layers of 64 tanh neurons. Across 8,190 development observations, neuron 15 in the first layer and neuron 1 in the second are nearly constant. Downstream biases absorb their former contributions, freeing the units to convert the mean of forward rays 520–559 into a speed adjustment.
The first circuit adds up to 0.60 m/s. The second subtracts up to 0.60 m/s when clearance is low and adds up to 0.30 m/s in open space. Each candidate changes 1,276 of the actor’s 73,474 scalars, out of 146,885 in the full checkpoint. The largest steering deviation on the development observations is 0.0000597 in normalized units.
Starts and verification
Development uses five starts on four tracks. Initial validation uses five on each of the other 17. After the cautious revision, final testing uses ten fresh seeds per track on all 21 tracks, from 7001 to 16010. The historical environment used 19 tracks and different software versions. The local benchmark measures the effect of the edit on the available maps.
Each episode lasts up to 200 simulated seconds. Finishing requires visiting at least 99% of the waypoints in order and crossing the start line without a simulator collision. Models share starting poses and LiDAR noise. Times compare laps completed from the same starts by the specified models. A negative value means a faster lap.
Loading each checkpoint through PPO reproduces the evaluator’s actions exactly on 128 observations. Repeating two original episodes also reproduces their outcomes. The ten trials on a track share its geometry.
Finishes and times by track
| Track | Original | Cautious | Paired lap time |
|---|---|---|---|
| Austin | 10/10 | 10/10 | +4.71% |
| BrandsHatch | 10/10 | 10/10 | +3.93% |
| Budapest | 4/10 | 9/10 | +4.02% |
| Catalunya | 10/10 | 10/10 | +3.86% |
| Hockenheim | 10/10 | 9/10 | +4.56% |
| IMS | 7/10 | 7/10 | +2.06% |
| Melbourne | 10/10 | 10/10 | +3.66% |
| MexicoCity | 10/10 | 10/10 | +3.23% |
| Monza | 5/10 | 8/10 | +1.83% |
| MoscowRaceway | 10/10 | 10/10 | +4.44% |
| Nuerburgring | 10/10 | 10/10 | +4.03% |
| Oschersleben | 1/10 | 7/10 | +4.12% |
| Sakhir | 10/10 | 10/10 | +2.99% |
| SaoPaulo | 10/10 | 10/10 | +4.26% |
| Sepang | 10/10 | 10/10 | +3.24% |
| Silverstone | 9/10 | 9/10 | +3.88% |
| Sochi | 0/10 | 0/10 | — |
| Spa | 7/10 | 10/10 | +3.55% |
| Spielberg | 10/10 | 10/10 | +3.04% |
| YasMarina | 5/10 | 5/10 | +4.28% |
| Zandvoort | 10/10 | 10/10 | +4.94% |