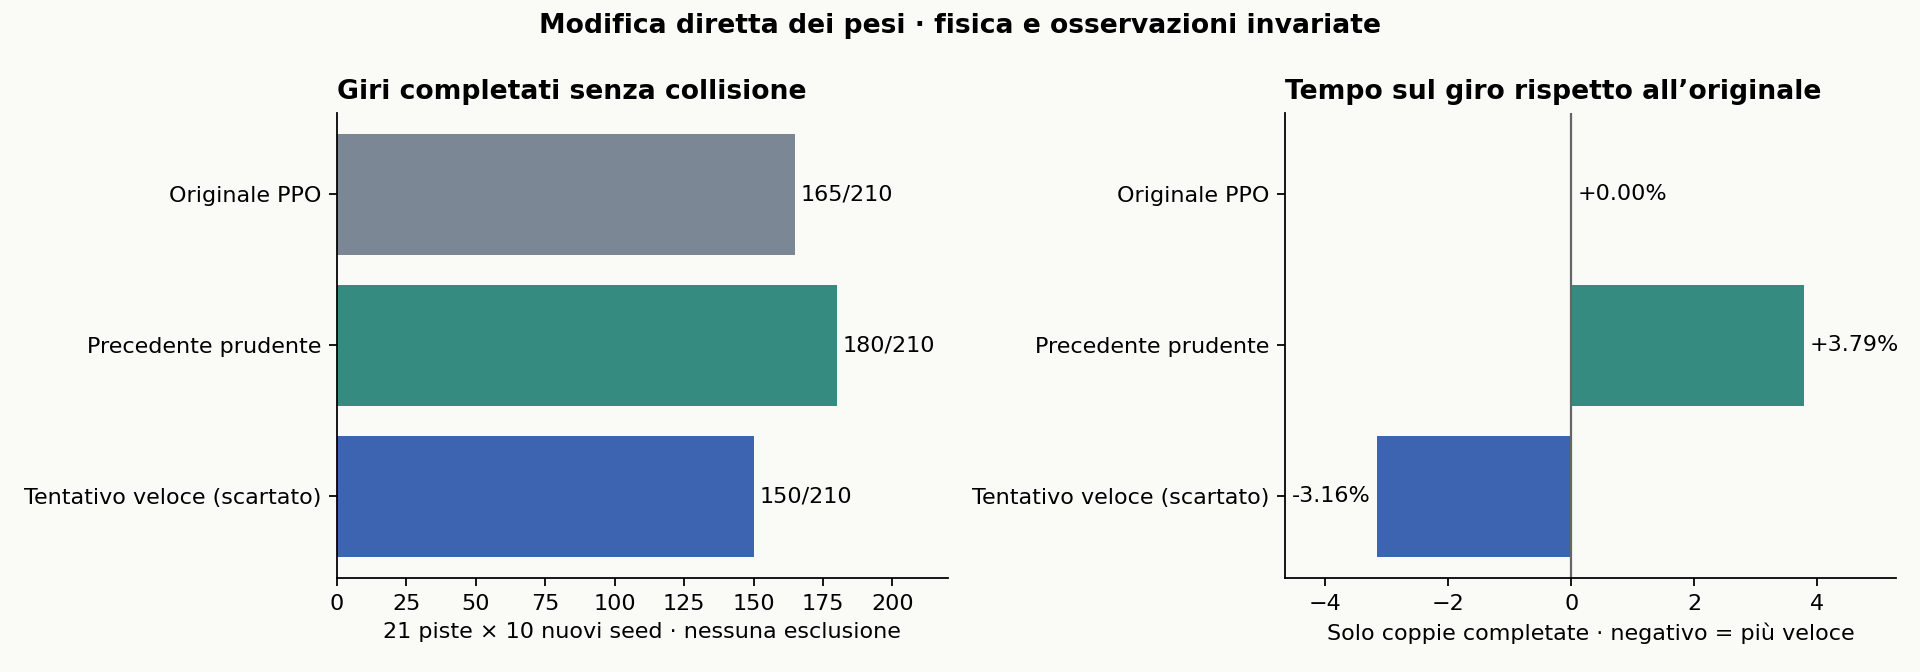
| Model | Completed laps | Collisions | Paired time vs. original |
|---|---|---|---|
| Original PPO | 165/210 | 45 | baseline |
| Previous cautious model | 180/210 | 30 | +3.79% |
| Rejected fast candidate | 150/210 | 60 | -3.16% |
Compensating for curvature
The single-track dynamics predict how the gain from steering to yaw rate changes between 8.5 and 8.8 m/s. The candidate multiplies the original steering by 1.02721087931901 and adds 0.3 m/s before clipping. The calculation uses 66 scalars in the action head. The formula was checked on 6,889 observations and PPO loading on 256 per checkpoint.
Seven development hypotheses
| Weight edit | Development completions | Paired lap time |
|---|---|---|
clearance_speed |
0/21 | — |
two_gate |
9/21 | +0.11% |
two_gate_guard |
1/21 | +6.56% |
exit_guard |
7/21 | +0.86% |
geometric |
0/21 | — |
curvature_compensated |
10/21 | -3.09% |
straight_boost |
9/21 | -0.58% |
The original PPO finishes 10/21 development starts. Rewriting speed or adding lateral corrections destabilizes the car. After testing the frozen candidate, one last edit adds up to 1.8 m/s on straights. It is rejected on development data. Selection uses seven tracks and three seeds per track. Final testing uses 21 tracks, ten new seeds from 20001 to 29010 and three models, giving 630 final episodes and 798 overall.
Sideslip and countersteer
To identify possible drift, the diagnostic requires at least 0.5 consecutive seconds with absolute sideslip ≥5°, speed ≥3 m/s and steering opposite to yaw rate. No completed candidate lap meets the criterion. The longest interval is 0.13 s. At seven speeds between 3 and 20 m/s, the equilibrium analysis finds steering and yaw rate have the same sign.
Lateral forces are linear, and the model lacks wheel angular velocities and combined tire saturation. A single LiDAR scan can correspond to different dynamic states. Telemetry is used only for diagnosis. At YasMarina, seed 2202, 20.8% of 510 sampled points in the starting footprint lie in the wall. This start remains in the count.
Each episode lasts up to 200 simulated seconds. Finishing requires visiting at least 99% of the waypoints in order and crossing the start line without a simulator collision. Models share starting poses and LiDAR noise. Times compare laps completed from the same starts by the specified models. A negative value means a faster lap.
Finishes and times by track
| Track | Original | Cautious | Candidate | Paired time vs. original |
|---|---|---|---|---|
| Austin | 9/10 | 9/10 | 9/10 | -3.04% |
| BrandsHatch | 10/10 | 10/10 | 10/10 | -3.23% |
| Budapest | 2/10 | 9/10 | 2/10 | — |
| Catalunya | 10/10 | 10/10 | 10/10 | -3.12% |
| Hockenheim | 10/10 | 10/10 | 10/10 | -3.43% |
| IMS | 5/10 | 5/10 | 5/10 | -3.14% |
| Melbourne | 10/10 | 10/10 | 10/10 | -3.22% |
| MexicoCity | 10/10 | 10/10 | 10/10 | -3.14% |
| Monza | 6/10 | 6/10 | 2/10 | -2.87% |
| MoscowRaceway | 10/10 | 10/10 | 4/10 | -3.11% |
| Nuerburgring | 10/10 | 10/10 | 10/10 | -3.23% |
| Oschersleben | 0/10 | 4/10 | 0/10 | — |
| Sakhir | 10/10 | 10/10 | 10/10 | -3.13% |
| SaoPaulo | 10/10 | 10/10 | 10/10 | -3.09% |
| Sepang | 9/10 | 9/10 | 9/10 | -3.06% |
| Silverstone | 10/10 | 10/10 | 10/10 | -3.14% |
| Sochi | 0/10 | 0/10 | 0/10 | — |
| Spa | 6/10 | 10/10 | 4/10 | -3.22% |
| Spielberg | 10/10 | 10/10 | 10/10 | -3.25% |
| YasMarina | 8/10 | 8/10 | 5/10 | -3.08% |
| Zandvoort | 10/10 | 10/10 | 10/10 | -3.11% |